
Your power, pedalling torque and motor contribution in real time. Record, analyse and share every ride.
With eTuning Ride mode, you can see how much effort you are contributing and how much your Shimano motor is contributing. Watch the data change as you pedal, monitor motor temperature and save your ride to review its charts and statistics afterwards.
Ride is included in eTuning Pro for compatible EP6 / EP600 and EP801 motors. It uses the data available from the motor, without installing additional sensors.
Four readings that change how you see your ride
| In real time | What it shows |
|---|---|
| Your power · W | Your estimated pedalling power, calculated from torque and cadence. |
| Your torque · Nm | The torque you apply while pedalling. |
| You versus the motor · % | How the rider and motor share the contribution to propulsion. |
| Temperature · °C | Motor temperature and how it changes while riding. |
A virtual power meter, included in your Pro licence
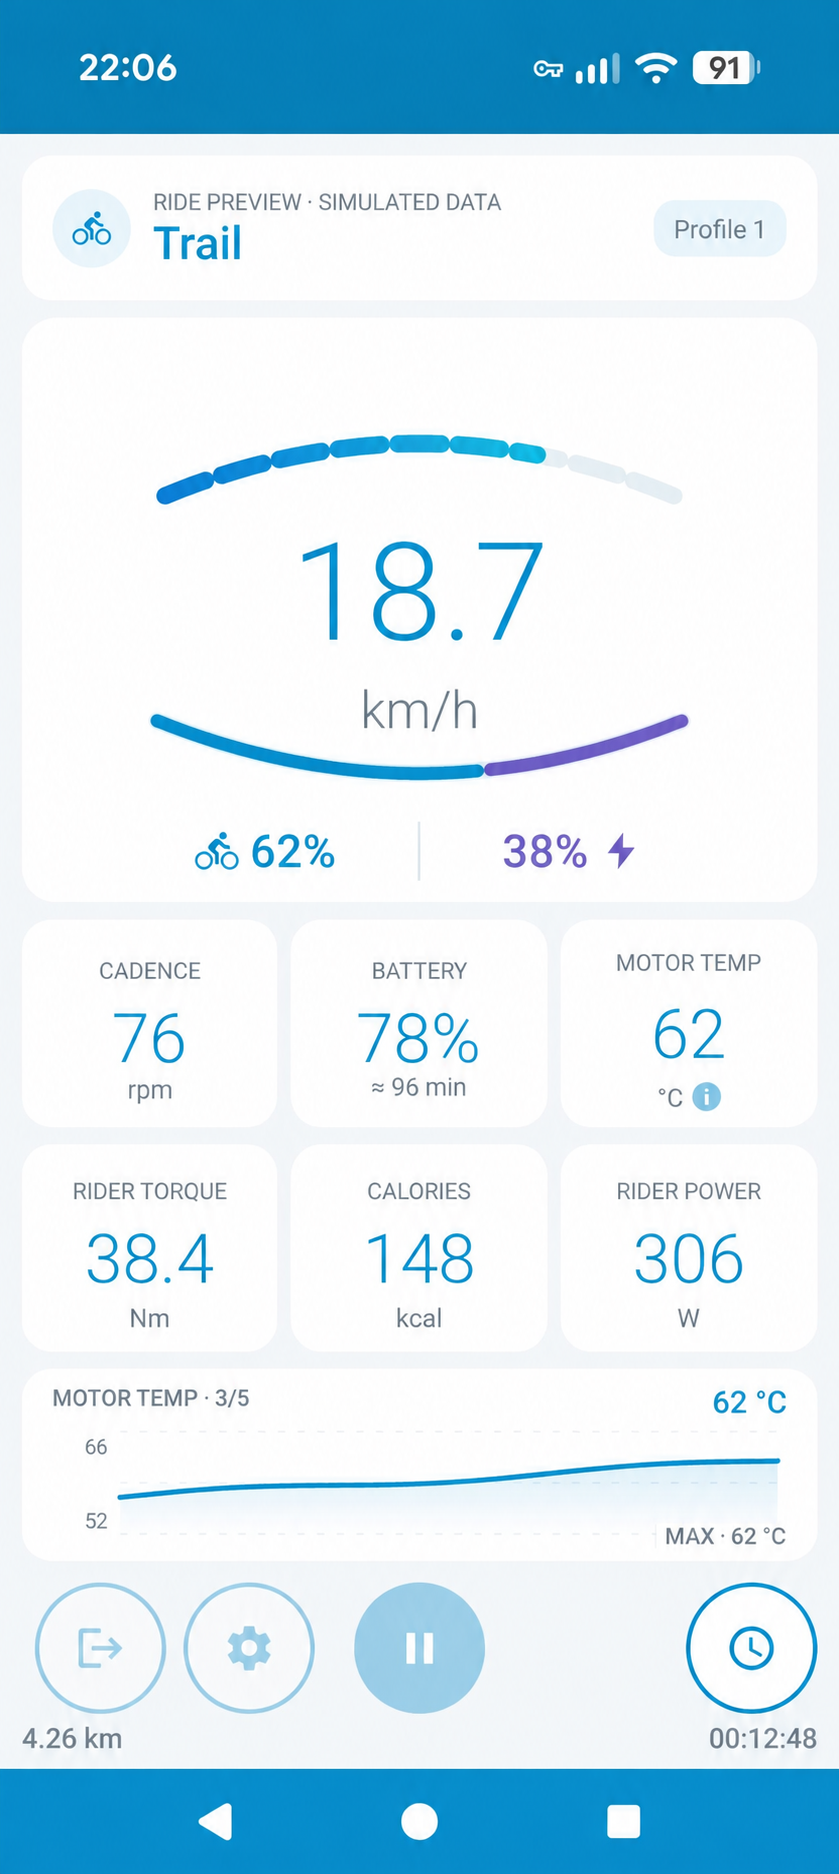
See your watts without changing cranks or adding a power meter. eTuning calculates your pedalling power from the torque and cadence provided by the motor. Alongside watts, you can view rider torque in Nm and cadence in rpm.
Push harder on the pedals and watch your contribution change. Adjust the assistance level and see how the balance between you and the motor changes. It connects what you feel in your legs with what is happening on the bike.
Motor temperature, in view
Follow the temperature on a climb and see how it develops when you maintain your effort or ease off. Afterwards, you can check average and maximum temperature, as well as the recorded time below and at or above 100 °C.
The charts let you compare temperature with motor power to identify periods of higher thermal demand. These data help explain its behaviour during the ride; temperature alone does not determine the motor’s condition.
Your effort and the motor’s, after the ride too
Save your ride and compare rider and motor contribution: power, torque, energy and time contributing power. The summary also shows each one’s best sustained efforts over 5 seconds, 30 seconds and one minute.
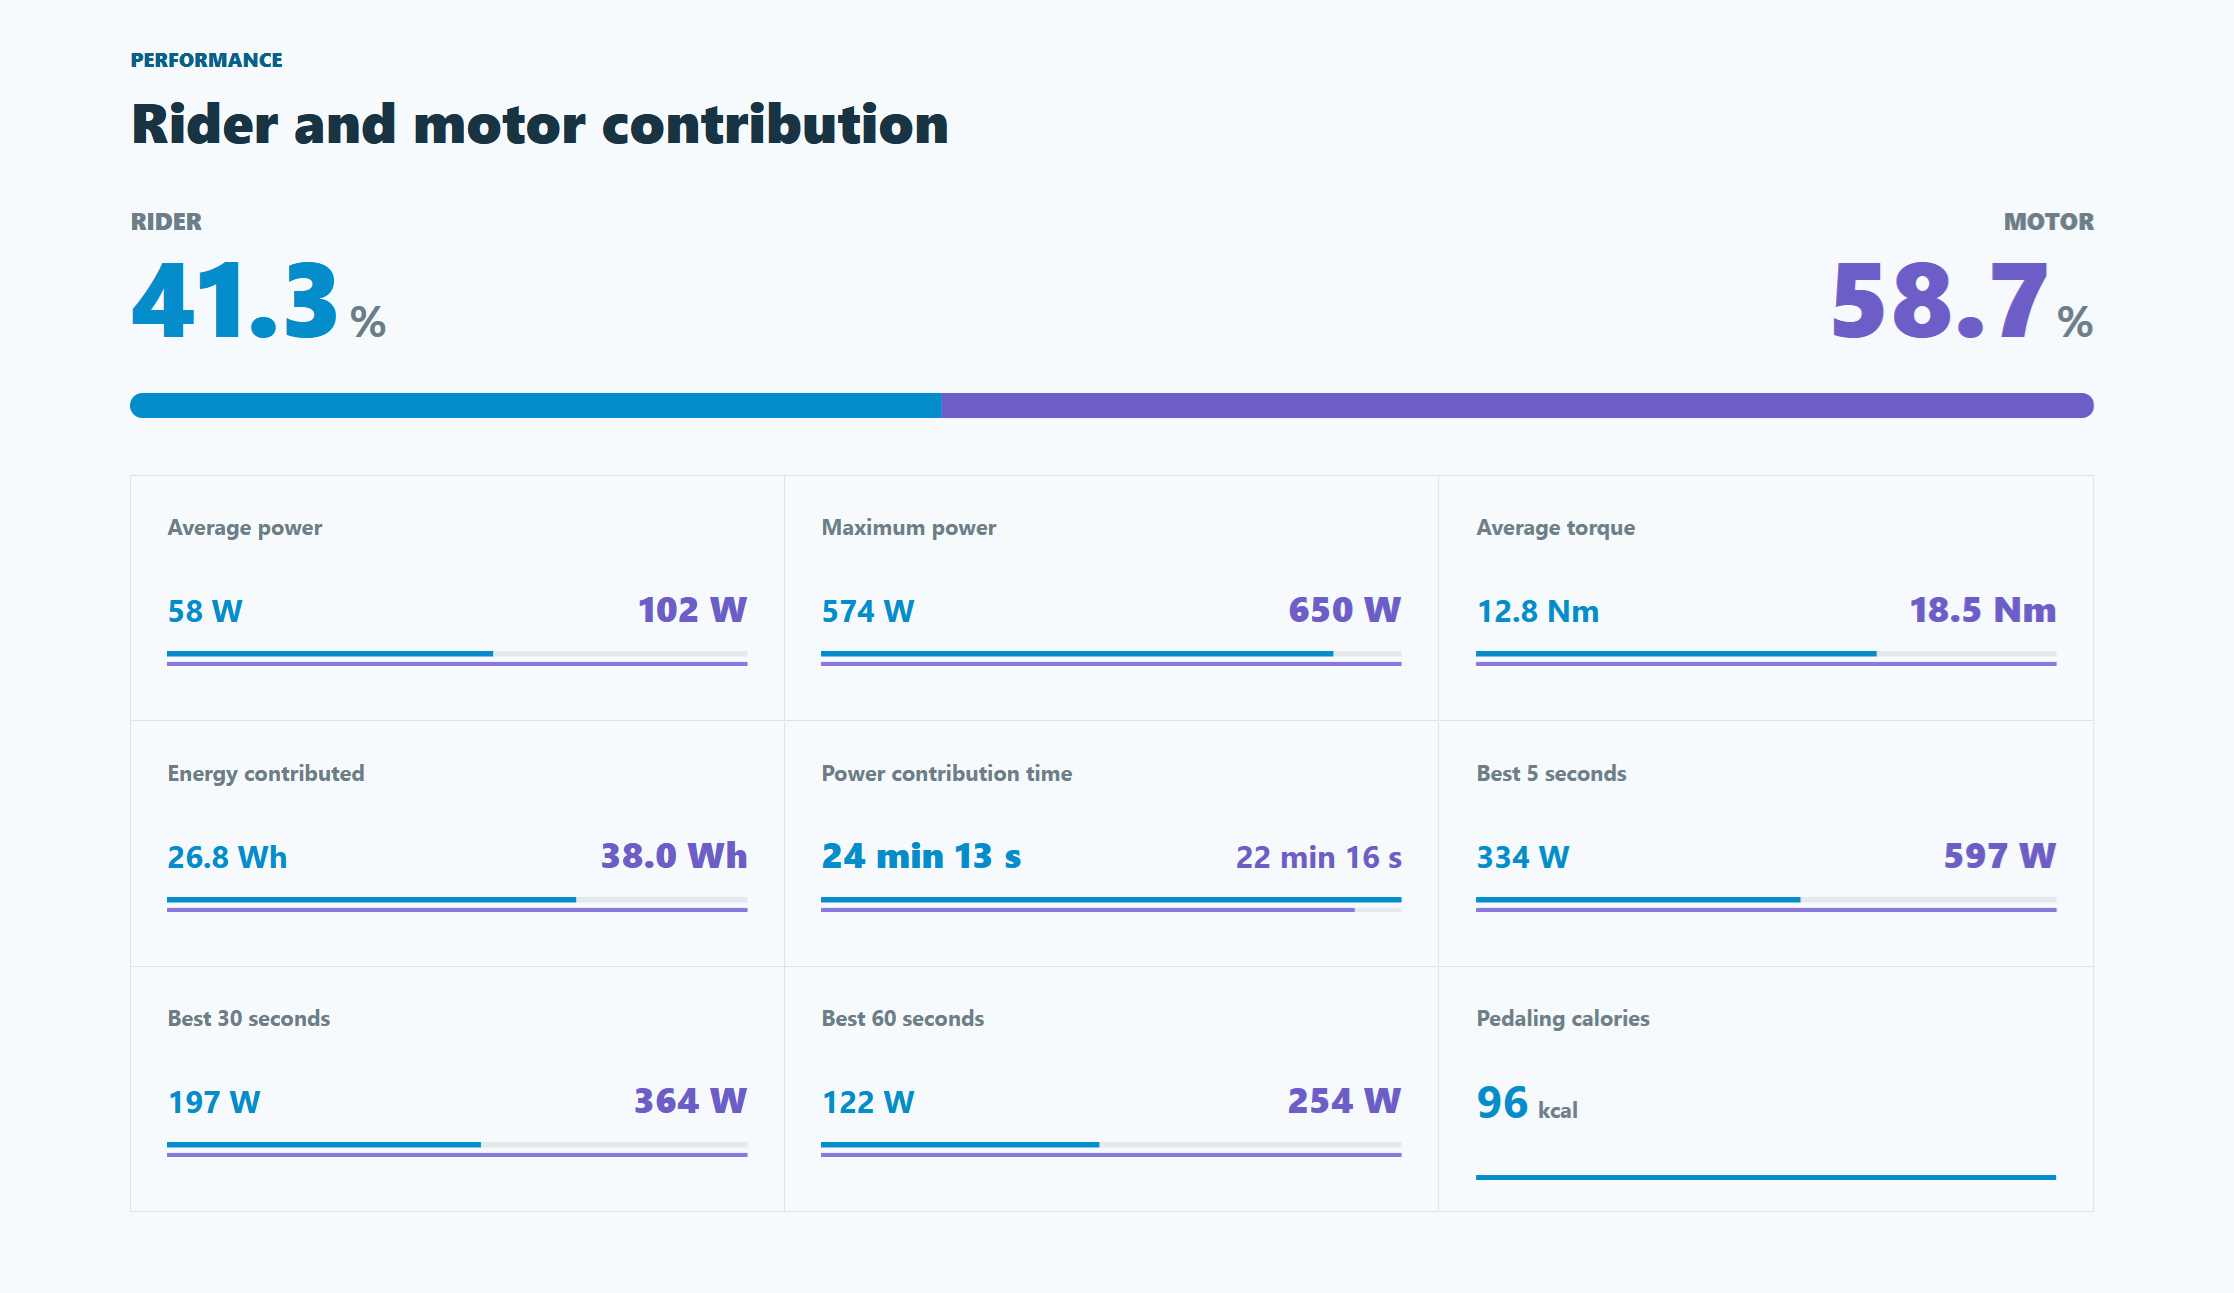
You can name your rides, keep them in your history and compare two rides to see how your effort and the motor’s contribution change.
Zoom into each section and see what happened
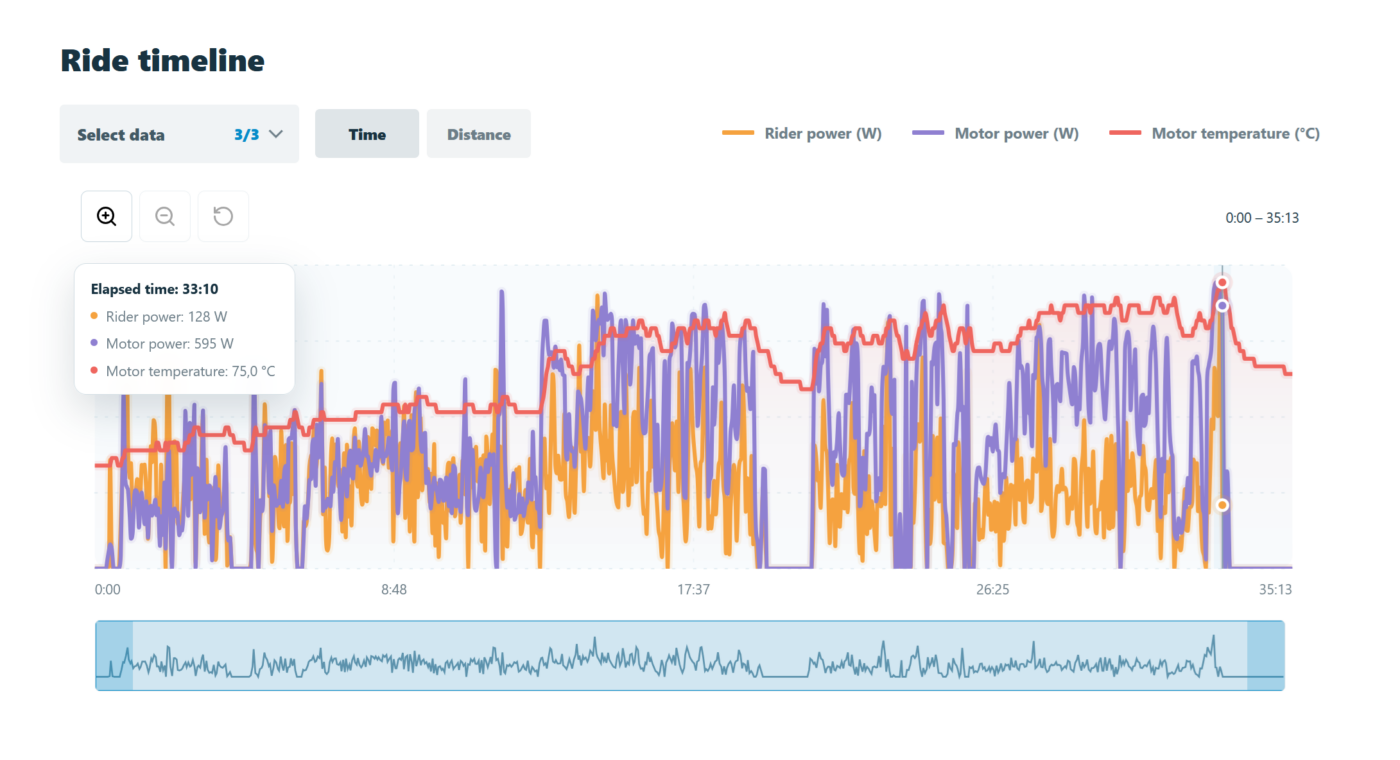
Overlay up to three parameters in one chart. For example, your power, motor power and motor temperature, as in the cover image.
Use zoom to review a particular section, move through the chart and select a point to see its values. You can set the horizontal axis to time or distance.
Share your ride with a link
Generate a public link to your ride’s statistics and charts and share it through WhatsApp, email or other apps. Show how the effort was shared and how the motor behaved throughout the ride.
Ride records telemetry without GPS: the link shows riding data without publishing a track of your route.
Explore a ride shared with eTuning Ride and view its statistics and charts:
Available with eTuning Pro
Ride mode is available for compatible EP6 / EP600 and EP801 motors with eTuning Pro.